Stock Research Tool
Calculators
Idea: "SELL AT" Calculator
Say I bought some shares (10) for a total of $100. I decide I want to sell them at/above a 20% return on my investment. What price is that based on my purchase? Steps:- enter the number of shares
(if there are batches, enter the total (total) number of shares) - enter the total cost
(the calculator will divide it by the shares to get a "per share" (costPerShare) estimate) - enter the % ROI you want
(the calculator will find the pershare you want: costPerShare * % + costPerShare) - save w/ticker (optional)
(once you know the number)
Drag/Drop Buckets
TODOs
Website Resources
- http://faviconer.com/ - Favicon Creator
Investing Site Links/Resources
Approach: Zacks Trading Styles
- Momentum Style:
- "Trend is your friend"
- Price to Sales Ratio of < 1=Good
- Aggressive Growth Style:
- - Often small cap.
- - 50% growth rates (not highest or lowest -- median in their peer group)
- Value Style:
- - "Good stock at a great price"
- - P/E not enough! Must have a positive CATALYST (such as an upward earnings estimate revision -- zacks fav kind is Q1 and F1 over last 4 weeks)
- Growth and Income Style:
- - "Good company with solid revenue that pays a good dividend"
- - Focus on mid-caps and smaller large-caps with best dividend yields (this can mean there is still runway for growth)
- 'All Style' Style:
- - Mix and match of the best pieces of each style. "Once you understand the differnt trading styles and how they work together, you'll find yourself picking better stocks" (hmmm)
- Technical Analysis:
- - chart pattern recognition ...author also uses RSI Oscillator, amongst others.
- - "Whether you are a fundamental trader or a technical trader each has something to offer.... check both the charts and the fundamentals"
Approach: "The Simple Path to Wealth"
11/20/16 - Reading "The Simple Path to Wealth", by JL Collins.
You only need three investment tools:
- Stocks: VTSAX (Vanguard Total Stock Market Index Fund) (NOTE: Fidelity alternative is "FSTVX")
- Bonds: VBTLX (Vanguard Total Bond Market Index Fund) (NOTE: Fidelity alternative is "FSITX")
- Cash: Held in Money Market at your local bank.
Book says:
- Stocks (passive index of the whole market) provides best returns over time and serve as a hedge against INFLATION.
- Bonds provide income, tend to smooth out the rough ride of stocks and serve as a hedge against DEFLATION.
- Cash is good to have around for routine expenses and to cover emergencies. Hold these at your local bank/credit union--where you get FDIC insurance coverage for up to 250K and a modest interest rate.
Source for Vanguard/Fidelity alternatives: https://www.bogleheads.org/wiki/Fidelity
Approach: "Big Safe Dividend"
12/26/15 - Reading "The Little Book of BIG Dividend: A Safe Formula for Guaranteed Returns" by Charles B. Carlson, CFA.
This book proposes an approach to finding stocks which pay dividends as well as promising total returns on the stock at sale.
Site is here: http://www.bigsafedividends.com/
Here's their "BSD" chart...it looks like they keep it up-to-date: http://www.bigsafedividends.com/bsdchart.aspx
General Notes
- Is the market expensive?
(See "Buffett Indicator" aka "market-cap-to-GDP ratio")
What returns can we expect from the stock market?
Ratio = Total Market Cap / GDP Valuation
More info: http://www.dummies.com/personal-finance/investing/tactics-and-principles-for-small-cap-investment-success/75% < Ratio < 90% Fair Valued 90% < Ratio < 115% Modestly Overvalued Ratio > 115% Significantly Overvalued Where are we today... http://www.gurufocus.com/stock-market-valuations.php -
General Economic Gauges
- https://tradingeconomics.com/ - an online source for global data
- https://www.usatoday.com/story/money/2019/03/24/recession-investors-need-global-view-stay-calm/3229562002/ - "...an easy online source for global data including inflation, interest rates, GDP and much more is tradingeconomics.com."
-
RSI
- "Trend is your friend" is a cardinal rule of technical analysis and the investors/traders can benefit by trading in the direction of the trend. The RSI is also used for determining and confirming the trend.
- More about using RSI a BUY (oversold) and SELL (overbought) signals: http://articles.economictimes.indiatimes.com/2013-04-08/news/38374193_1_rsi-overbought-zone-swing
- "...most technical analysts consider the RSI value above 70 as 'overbought zone' and below 30 as 'oversold zone'"
- ** see "failure swings" at the quoted article.
Approach: Tangent Portfolio (Ben Stein)
Tangent Portfolio Tool (Ben Stein)| ASSET CLASS | FUND | TICKER |
| BONDS | ||
| Treasury Bonds | IEI | |
| Inflation Bonds | TIP | |
| Foreign Bonds | BWX | |
| LOW BETA STOCKS | ||
| Energy | IXC | |
| Consumer Staples | KXI | |
| Utilities | JXI | |
| Health Care | IXJ | |
| SMALL/VALUE STOCKS | ||
| US | VBR | |
| Developed Markets | DLS | |
| Emerging Markets | DGS | |
Approach: Money Ratios
| Your Money Ratios: 8 Simple Tools for Financial Security | |||||||||
| Age 65 & 80% Income Replacement | Mortgage Debt | Education Debt | Investements | Disability | Life Insurance | LTC Ratio | |||
| Age | Capital to Income Ratio | Savings Ratio | Mortgage to Income Ratio | Debt to Avg Income Ratio | Stocks ( i) | Bonds ( i) | % of Monthly Income | Insurance to Income Ratio | Project Ratirement Income to LTC Costs |
- For BONDS: FIBIX (Fidelity mutual fund of Intermediate term US Treasury Bonds only.)
- For STOCKS: (not doing this yet, but it should be the S&P500 ...I think, see the book)
BUY/SELL indicators
NOTES: (these are very general...just trying to develop my approach over time by capturing my thoughts so I can see them later)
- SELL when:
- FOR WIN: (the main idea here is to take your wins and propogate them into new wins... without
trading exceptional income-producing power if possible.)
- current owned position is above 100% gain
- longer than 1 year holding period (take gains at the lower capital gains tax rate)
- PE > 20 (or more generally when it's higher than it's peers PEs...you can see this generally in Google's stock screener at finance.google.com when looking up a symbol)
- Dividend is below "n%" (some arbitrary threshold based on the current dividend percentages available by locking the money up elsewhere ...in other words if you are getting a great yield on the money--and there isn't a better currnet-income producing alternative you might consider avoiding rushing out of the stock just because it's other sell-at-a-win indicators are true.)
- FOR LOSS: (the main idea here is to keep your investment money working for you... dead money
SUCKS!) (consider for tax loss harvesting, and for capital protection... though I have
not yet successfully included this process in my process)
- BEFORE the 1 year holding period (to take losses at your current marginal-income tax rate)
- PE > 20 (or high compared to peers)
OR NO PE...which means the company's earnings are negative!! - No dividend (this means the money is dead money, it's not producing anything!)
- FOR WIN: (the main idea here is to take your wins and propogate them into new wins... without
trading exceptional income-producing power if possible.)
- BUY when:
- On the MF (Joel Greenblatt's Magic Formula from The Little Blue Book that Beats the Market)
- Pays a dividend (particularly if it's a compelling dividend) (I've found that when a stock ends up sucking over the year long holding period, it feels better to at least have been collecting a dividend that's better than what you'd get for parking that money in a savings account)
- It's PE is < 20 (but more importantly, when it 's PE is below it's peers averages)
- When consensus price targets are above the current price you can buy at (this means at least other folks are looking at it and there's some anaylst coverage... which means somebody thinks its worth paying attention to... at least that's what I think it means)
Magic Formula (Joel Greenblatt)
Magic Formula Site (Joel Greenblatt) Scripts to restore functionality to allow you to cut/paste into a spreadsheet for further analysis.Market Sentiment
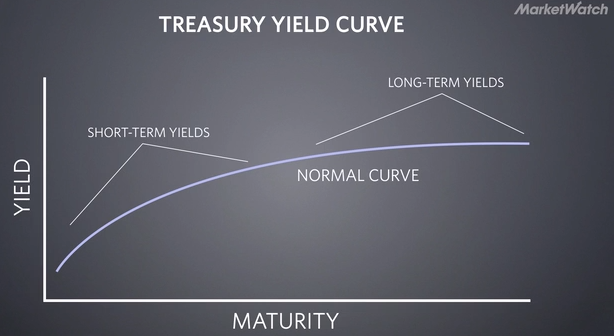
(1) TREASURY CURVE
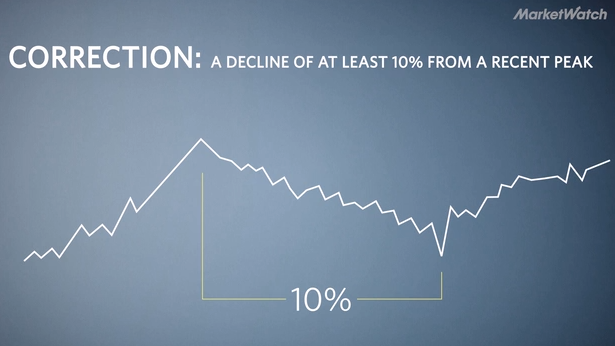
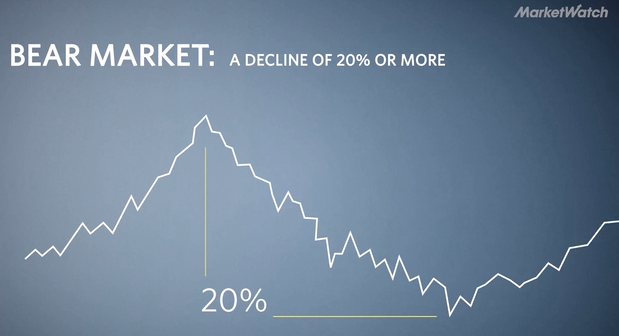
For example, is a downturn a "correction" (10%), a "bear market" (20%), or something more? A correction can be a more normal occurrence in a cycle, but a bear market can put a damper on investor sentiment because no one knows when the decline will stop and whether something more substantial is looming.
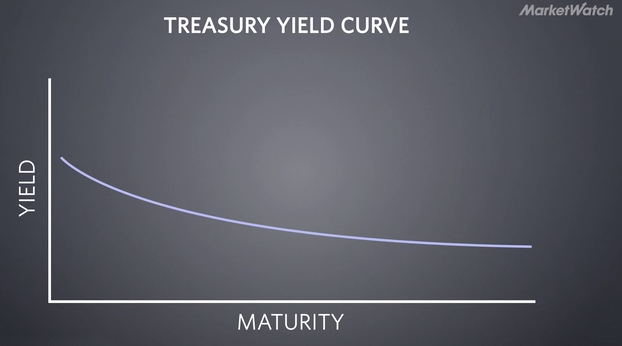
Looking at the shape of the Treasury Yield Curve can provide some indication of larger market sentiment. A healthy curve shows that investors expect a greater return for lending money over a longer period of time. However, an unhealthy (inverted) curve may indicate doubts about the long term economic expansion. An inverted curve has preceeded each recession since WWII.
Where can I see the current treasury curve graphed? https://www.gurufocus.com/yield_curve.php (Note to self: consider plotting this using treasury.gov data in the future (?))
(2) ECONOMIC DATA
GDP and Unemployment Is GDP high, or at least inline with historical norms? Is Unemployment low, or at least inline with historical norms?
Here's the video on marketwatch.com that prompted this examination. Most of the info comes from this piece from Ellie Ismailidou. http://www.marketwatch.com/video/explainomics/how-to-tell-the-difference-between-a-market-crash-and-a-correction/4EB0B6E3-D2E7-40C6-A436-9C68525123E6.html